
The business situations in this article are fictional illustrations, not accounts of Parikh Advisory client engagements.
A small SaaS team launches its first release. People create accounts, but few complete the task the product was designed to make easier. The founder says, “Nobody is using it,” and asks for another feature. That sentence may describe several different failures, each requiring a different response.
Illustrative scenario. Sign-up can show curiosity, a successful campaign or a procurement requirement. It does not tell us whether the right person reached value. Before changing the roadmap, follow a user from the promise that brought them in to the first meaningful result.
Define the job that would count as value
Imagine the product helps a team approve supplier requests. Is the meaningful action creating an account, inviting a colleague, submitting a request, receiving an approval, or completing a purchase under the new process? The answer should reflect the customer’s job, not whichever event is easiest to track. A user who signs up and leaves before inviting an approver may be stuck; a user who approves a quarterly request and returns three months later may be succeeding.
Agree on the expected frequency of the job. Daily active users are a poor measure for a quarterly workflow. Define the first useful outcome and an appropriate window for return before interpreting a retention chart. Segment the people who signed up by role, source, organization and intended task where the data and privacy permissions allow. Aggregate averages can hide that one group succeeds while another never had a reason to use the product.
Follow the situation
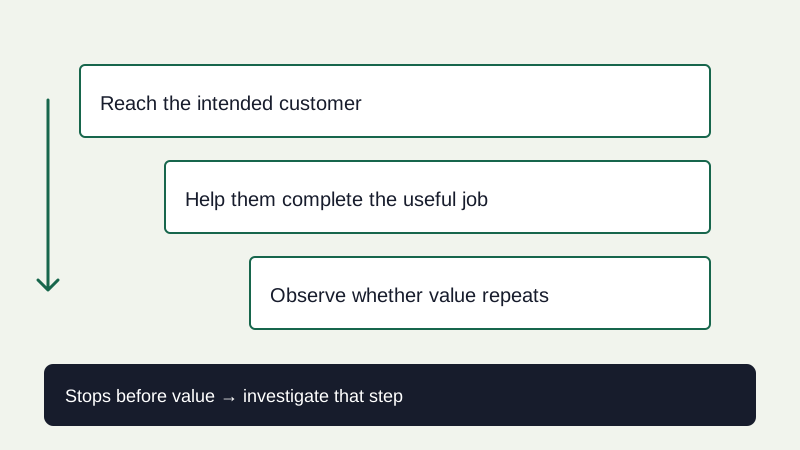
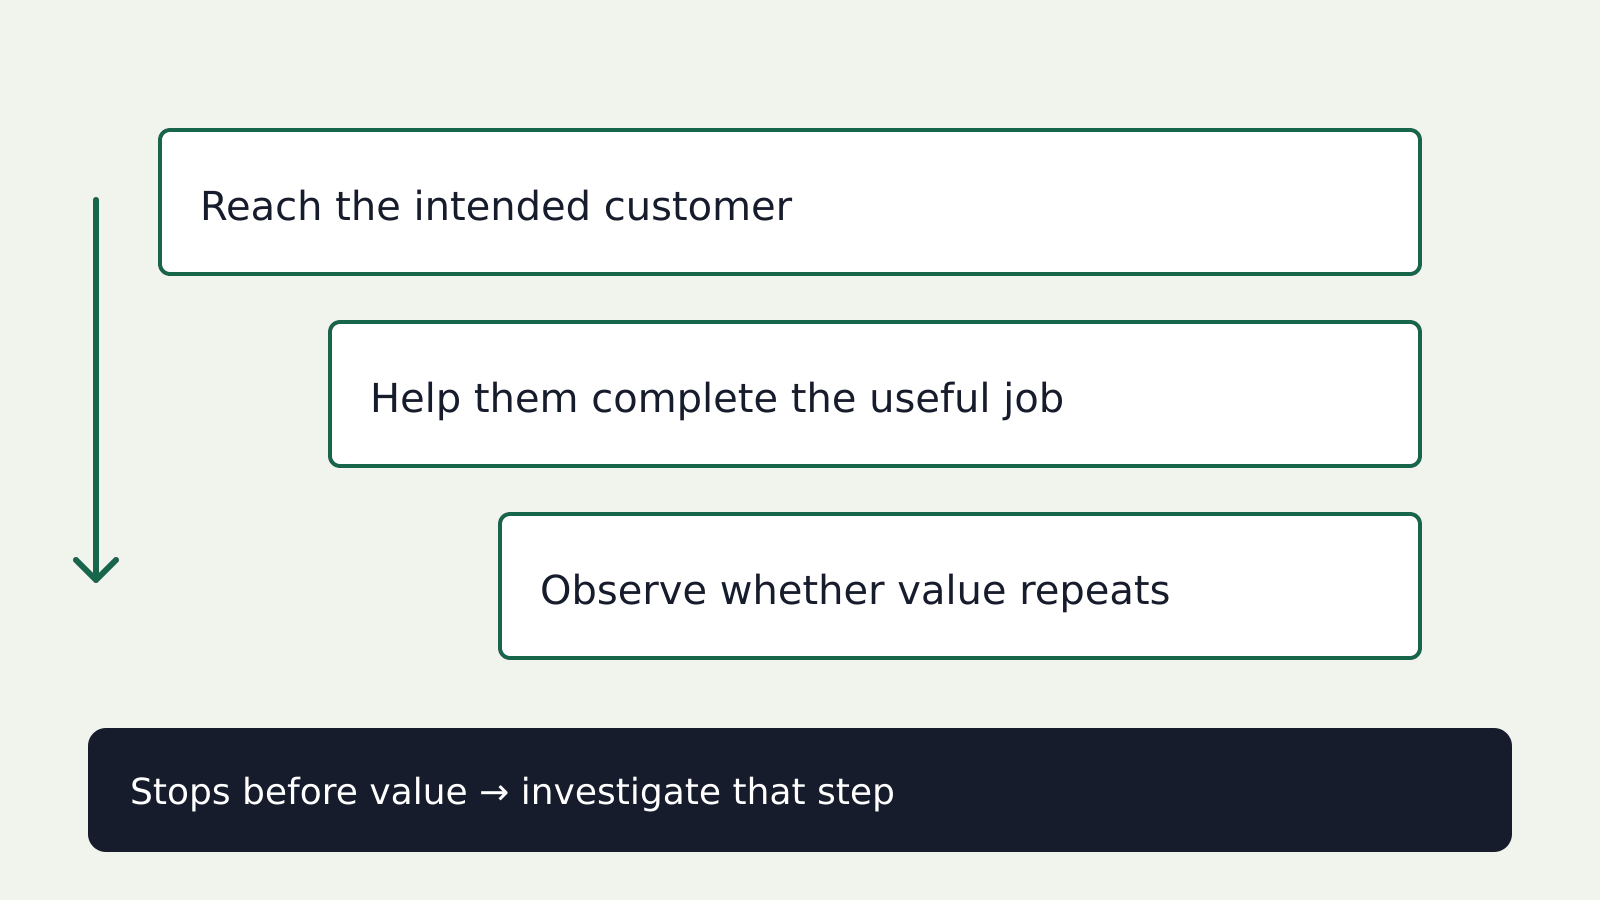
- Reach the intended customer
- Help them complete the useful job
- Observe whether value repeats
- Stops before value → investigate that step
Locate the break in the journey
Trace the sequence: invitation or discovery, account creation, setup, first attempt, first completed result, later need and repeat use. For each transition, ask how many eligible people reached it and what they were trying to accomplish. A drop after sign-up could reflect confusing setup, missing permissions, poor data, weak trust or a promise that does not fit the buyer. A drop after first success could reflect low natural frequency rather than dissatisfaction.
Analytics shows where activity stops, not why. Watch a few relevant people perform the task, inspect support conversations and speak with users who left as well as those who stayed. Do not ask only “Would you use this?” Ask what they last tried to do and what happened. If customers were acquired through a broad campaign, check whether they were actually the target segment before blaming the product interface.
Choose a response that tests an explanation
Suppose requests are submitted but stall because the approver has not been invited. The next test might be a clearer invitation, a manual handoff or a narrower team onboarding process. If people never start a request because their company lacks an approved policy, a new dashboard will not resolve the blocker. If users complete the task but return only when a new supplier is onboarded, the product may be working as intended at a lower frequency.
Write down the competing explanations, the evidence for each and the smallest test that could distinguish them. Change one part of the journey with a defined group and observe the intended outcome. Do not celebrate a higher click rate if completed requests and customer effort do not improve.
The commercial question is separate
Use and willingness to pay are related but not identical. A user may love a tool while a budget owner cannot justify it. A buyer may sign a contract and still fail to get employees to adopt it. Follow both journeys: the user’s path to value and the buyer’s path to purchase, implementation and renewal. Name who owns each obstacle.
If the evidence shows the wrong segment was acquired, revisit positioning and distribution. If the first useful result is blocked, fix the workflow. If repeat value is weak despite a completed journey, investigate whether the underlying problem is frequent or costly enough. “Build more features” is one possible response, not a diagnosis.
Compare the next moves
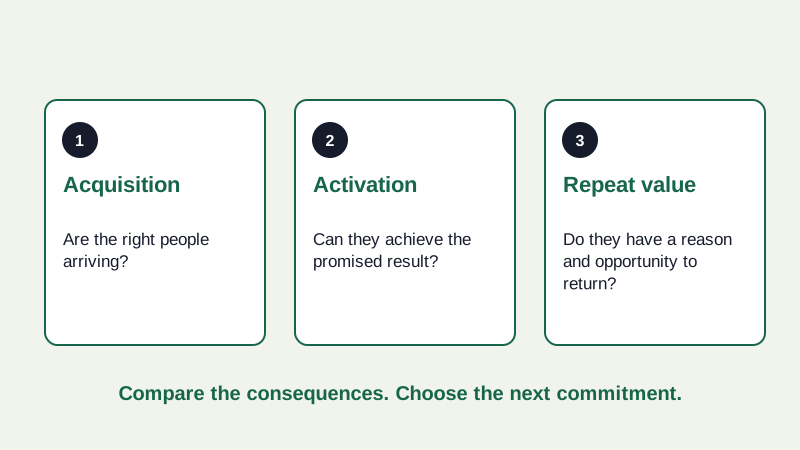
- Acquisition: Are the right people arriving?
- Activation: Can they achieve the promised result?
- Repeat value: Do they have a reason and opportunity to return?
A one-page diagnostic
- The intended user, buyer and job, with its natural frequency.
- The first meaningful outcome and the event that indicates it occurred.
- A journey broken down by eligible cohorts, not sign-ups alone.
- Two or three competing reasons for the largest meaningful drop.
- One test, owner, review date and result that would change the plan.
Method reference: Amplitude’s product analytics guide distinguishes sign-up, critical action and returning use, and discusses cohort analysis. Its framework is a measurement aid, not evidence about this fictional SaaS product. Direct observation is needed to explain the behaviour behind the numbers.
Sources & scope
Related primary reading is provided below. The decision framework and fictional examples are Parikh Advisory’s analysis; these references do not establish that the illustrated events occurred.
- Understand users and their needsUK Government Digital Service