
The business situations in this article are fictional illustrations, not accounts of Parikh Advisory client engagements.
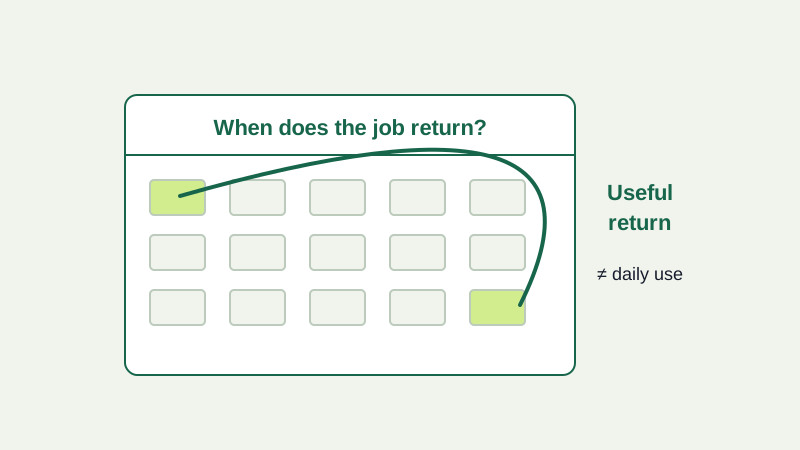
A founder sees sign-ups rise after a campaign. A month later, few accounts have returned. The immediate conclusion is that onboarding failed. But the product helps small businesses prepare a quarterly tax task. Many customers may have no reason to return within thirty days.
Illustrative scenario. A return chart has meaning only when it is tied to the customer’s job and its natural rhythm. The first question is not “How do we make people open the product more often?” It is “When should a successful customer need it again, and what would they do then?”
Choose the right clock
For a daily collaboration tool, a week of silence may be concerning. For a quarterly filing tool, it may be normal. Define the expected interval from the user’s work, not from an analytics dashboard default. Then define a meaningful return: completing another task, updating information, reviewing a notice, or using the result. A login without progress is weak evidence of value; a successful task completed offline may not appear in product events at all.
Separate first value from return value. If a user never completed the initial task, investigate activation. If they did complete it but have not had a new occasion to use the service, a retention intervention may be premature. If the next occasion arrived and they used a workaround instead, the product has a more specific problem to investigate.
Follow the situation
- Define the meaningful action
- Group users by relevant cohort
- Observe the next genuine need
- Annual task → daily-use target misleads
Compare people who had the same opportunity
Group accounts by when they first had a reason to use the product and by the task they came to do. A campaign may bring students, accountants and business owners into the same sign-up chart, although they have different jobs and permissions. Compare cohorts that reached first value, then had a subsequent opportunity to return. Avoid treating accounts that signed up yesterday as if they have had the same opportunity as those acquired months ago.
Look at acquisition source too. A broad promotion can bring people who were curious but never intended to file through the product. A contracted organization may require employees to register even though their role gives them no recurring task. Both inflate the denominator. Do not remove them silently; show how the conclusion changes under different definitions.
A simple diagnostic table is more useful than one headline percentage: cohort, intended job, first meaningful action, next expected occasion, observed return, and what is unknown. Include the size of each group. Small cohorts can move dramatically with one or two people and should not be presented as a stable trend.
Find out what happened at the next occasion
Talk to a few customers whose next task was due. Did they remember the product? Did they trust its output? Had the task changed? Was a colleague now responsible? Did they complete the work elsewhere because data was missing or the service was too slow? Interviews reveal explanations that event data cannot; they do not establish prevalence without broader evidence.
Look beyond the interface. In the tax example, a customer might return only when an accountant requests documents. If the service never connects to that handoff, reminders may create activity without solving the job. A product change, communication change or partnership with the accountant may each be plausible. The evidence should guide which to test.
A decision proportionate to the evidence
If people had no reason to return yet, improve measurement and wait for an eligible interval. If they had a reason but could not complete the task, investigate the blocked journey. If they completed the task elsewhere, test the proposed improvement with that segment. A generic re-engagement campaign may increase visits while leaving the underlying failure untouched.
State the review trigger before changing the product: which cohort, which task, what time window and what outcome would change the recommendation? The founder can then distinguish a weak habit from an infrequent but valuable service.
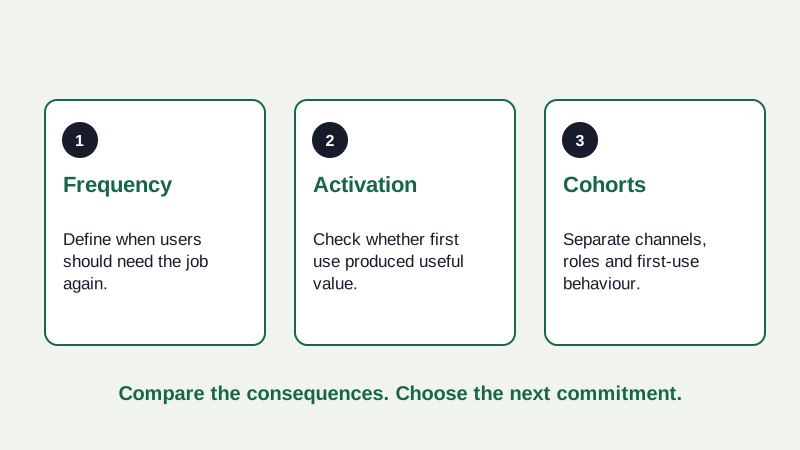
Compare the next moves
- Frequency: Define when users should need the job again.
- Activation: Check whether first use produced useful value.
- Cohorts: Separate channels, roles and first-use behaviour.
Questions for the next retention review
- What job brought this group in, and when should that job recur?
- Which people reached first value and had a fair chance to return?
- Does our event definition capture the customer’s outcome or just a visit?
- What did nonreturning customers do when the need arose?
- Which result would justify a product change rather than a measurement or distribution change?
Research note: Amplitude’s retention framework discusses cohorts, usage intervals and how retention definitions affect interpretation. It is a measurement reference, not evidence about the fictional product above. The appropriate interval and action must be determined from the actual customer job.
Sources & scope
Related primary reading is provided below. The decision framework and fictional examples are Parikh Advisory’s analysis; these references do not establish that the illustrated events occurred.
- Understand users and their needsUK Government Digital Service